Multi-Timeframe Liquidity Zones V6 (Lines)Multi-Timeframe Liquidity Zones V6 (Lines) identifies key volume-based support and resistance levels across multiple timeframes (Monthly, Weekly, Daily, 4H, 1H, 30M, and 15M). It calculates the Point of Control (POC)—the price with the highest volume—and the Value Area High (VAH)/Value Area Low (VAL)—the range that captures the bulk of trading activity—based on a user-defined number of bars.
The indicator draws lines for these levels on the chart and labels them with the corresponding timeframe. This helps you quickly spot where major volume concentration may affect price movements, making it easier to plan entries, exits, and risk management. Simply adjust the “Bars Count” parameters to suit your preferred timeframe or market volatility.
While these volume levels often coincide with strong support/resistance zones, it’s best to combine them with other technical tools or price action for confirmation. In short, Multi-Timeframe Liquidity Zones V6 (Lines) offers a clear, consolidated view of crucial volume-driven levels, streamlining multi-timeframe analysis and enhancing your overall trading strategy.
Cerca negli script per "point of control"

Combined SmartComment & Dynamic S/R LevelsDescription:
The Combined SmartComment & Dynamic S/R Levels script is designed to provide valuable insights for traders using TradingView. It integrates dynamic support and resistance levels with a powerful Intelligent Comment system to enhance decision-making. The Intelligent Comment feature generates market commentary based on key technical indicators, delivering real-time actionable feedback that helps optimize trading strategies.
Intelligent Comment Feature:
The Intelligent Comment function continuously analyzes market conditions and offers relevant insights based on combinations of various technical indicators such as RSI, ATR, MACD, WMA, and others. These comments help traders identify potential price movements, highlighting opportunities to buy, sell, or wait.
Examples of the insights provided by the system include:
RSI in overbought/oversold and price near resistance/support: Indicates potential price reversal points.
Price above VAH and volume increasing: Suggests a strengthening uptrend.
Price near dynamic support/resistance: Alerts when price approaches critical support or resistance zones.
MACD crossovers and RSI movements: Provide signals for potential trend shifts or continuations.
Indicators Used:
RSI (Relative Strength Index)
ATR (Average True Range)
MACD (Moving Average Convergence Divergence)
WMA (Weighted Moving Average)
POC (Point of Control)
Bollinger Bands
SuperSignal
Volume
EMA (Exponential Moving Average)
Dynamic Support/Resistance Levels
How It Works:
The script performs real-time market analysis, assessing multiple technical indicators to generate Intelligent Comments. These comments provide traders with timely guidance on potential market movements, assisting with decision-making in a dynamic market environment. The script also integrates dynamic support and resistance levels to further enhance trading accuracy.

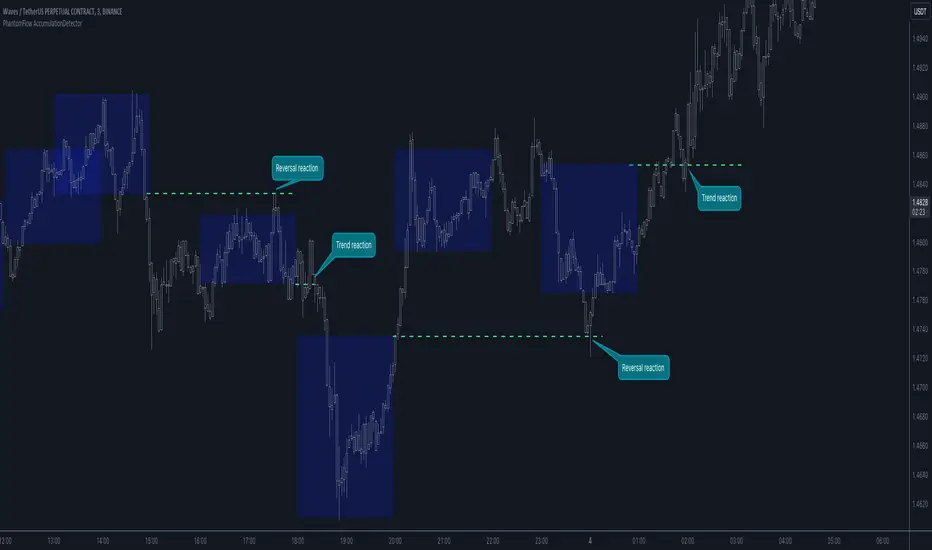
PhantomFlow AccumulationDetectorThe PhantomFlow AccumulationDetector indicator analyzes the volume profile and displays potential accumulation based on the selected timeframe in the settings. This indicator can be used both as zones for trend following and for identifying reversals, as shown in the examples on the chart. The logic behind the formation of the accumulation zone is based on the fact that the POC (Point of Control) of the current zone is within the Volume Area range of the previous period.
Optimal settings for the working timeframe should be chosen visually, and the size of the zones should not be too large or too small. Additionally, it's advisable not to consider overly wide zones during increased volatility.
Consecutive zones within the same range often indicate a potential reversal.
We borrowed the volume profile calculation code from @LonesomeTheBlue. Thank you for the work done!
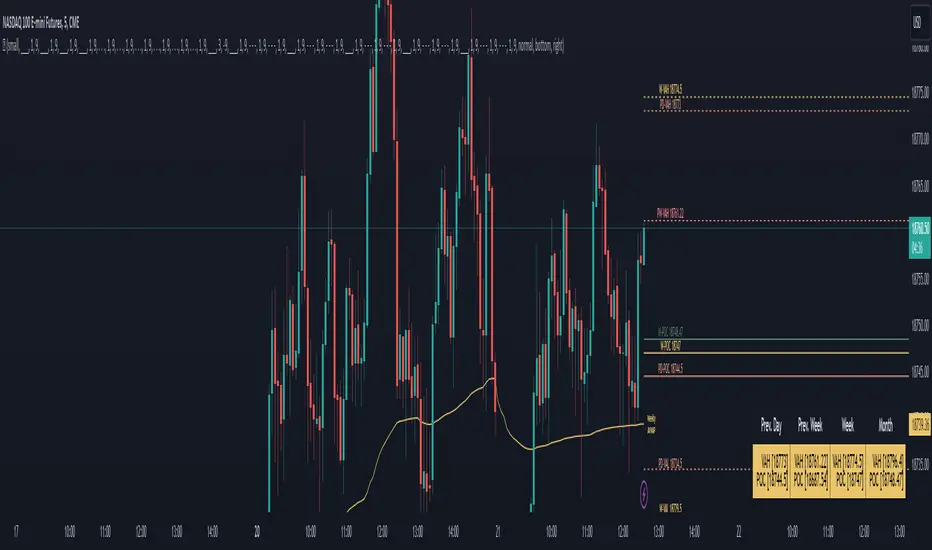
LevelsThe Levels indicator automatically draws important market pivots based on multiple timeframe value zones and pivotal trading areas. This information is displayed in front of the price, to keep things out of the way of your price action chart. All of these levels are fully customizable, for visual tranquility, and all values are available to set alerts on. Last but not least is an easy-to-read dialogue box so you know exactly where you are in the auction at a quick glance to save you time while analyzing charts.
Levels included:
Value Low (Day, Week, Month)
Value High (Day, Week, Month)
Point of Control (Day, Week, Month)
VPOCs (Daily)
Highs and Lows (Week, Month)
Average range zones( Day, Week, Month)
Market Profile Fixed ViewSome instruments does not provide any volume information, therefore, as a fixed volume profile user, I needed a fixed market profile indicator to use the same principles, regardless of whether the volumes are available or not.
This script draws a market profile histogram corresponding to price variations within a specific duration, you only need to specify Start and End date/time values to see the histogram on your chart.
Details
Two lines corresponding to highest/lowest prices are displayed around the histogram
The redline corresponds to the POC (point of control)
Options
Start calculation
End calculation
Bars number (histogram resolution, currently locked to a max value of 50 bars)
Display side/Width (allows to modify size of bars, to the left or to the right)
Bars/Borders/POC Color customization
Notes
This script will probably be updated (to add VAH/VAL zones, and maybe other options). However, some common market profile attributes have not been implemented yet since I don't really use them)

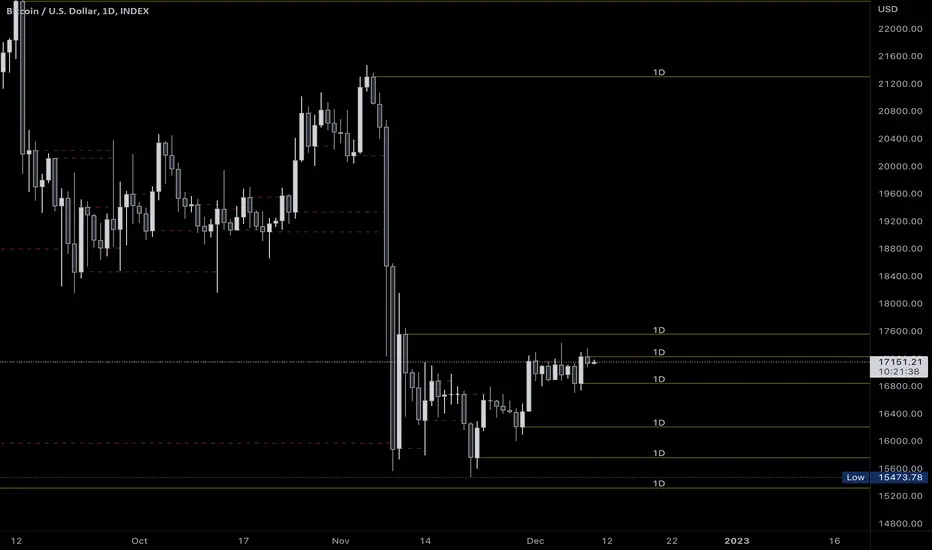
[BFR] Naked LevelsDetects significant naked levels(Levels that have not been touched since the candle closed) and draws them on chart. These provide excellent profit targets and often reversal levels.
Roadmap:
✅ Candle open
☑ Point of control
☑ Multiple timeframes
☑ Something else? Leave a comment.
Delta Bar Stats SpaceManBTCDelta Bar Stats SpaceManBTC
This is a supplementary tool to DeltaPrint Candles SpaceManBTC, Hence why its inclusion in the chart above. Orderflow traders have access to the bar statistics in a seperate,
container to the candles themselves. This aims to tackle that disparity by providing a solution to tradingview.
Using a calculation that is found in the DeltaPrint Candles SpaceManBTC the data reflected as you can see is the same in the TVOL and DVOL
parameters matching the Total Volume and Delta Volume parameters.
The tool Delta Bar Stats SpaceManBTC also provides access to extra information, Delta Price, Buy Volume, Sell volume.
The Delta price highlighting the DVPOC (delta volume point of control) and the 2 following
refrencing the total buy volume and sell volume in the candle respectively.
Additionally you can see on load 2 settings:
Dynamic Coloring Delta Volume,
changes color based on whether the Total Delta for the candle was positive or negative.
Dynamic Coloring Delta Price,
changes color based on whether price closed above or below the DeltaVPOC
Ticksize is used to determine the amount of data generated, the lower the more information will be provided on the current candle. Using AutoTickSize will do this automatically accounting for recent volatility .
Therefore when using and new, use auto, to switch between charts with ease. On charts that you always keep open it is recommended to manually tune ticksize to your choosing.

MarketProfileHello All,
The said script plots MarketProfile of previous Session. Additional Feature is that we can plot Developing pocLine on realtime basis. The script plots Va High, Va Low and Point of Control of previous session, which becomes reference for tracking the price behavior in next session.
Hope this can be further developed to include the Characters on the chart. It provides ability to plot profile for different timeframes
The script has borrowed Ideas from @lonesometheblue, @juliusCrypto and @Ricardo Sanstos

Low Timeframe POCI have recently made a High Timeframe POC script (HFT POC) which is pretty popular. Thanks for this!
There are many requests to include lower timeframes in this script, that is why I created this script. I could have incorporated all the timeframe POC's into one indicator but I went this route to keep things more organized between all the different timeframes.
Currently included: Daily, 6H, 3H and 1H
/* DEFINITION */
Point Of Control (= POC) is a price level at which the heaviest volumes were traded.
/* HOW TO TRADE WITH THIS INDICATOR */
The basis for POC is determining bias on whichever timeframe you choose.
1. Identify a POC on the timeframe of your choosing.
/* If you choose the lowest timeframe (1H here) then always make sure to look at the higher timeframes to see how it is trading against a HTF POC.
2. When the price is moving away from the POC (either to the upside or downside) this can confirm or invalidate a trade.
3. You can now enter the trade on bias or wait for a retest of the same POC.
/* EXAMPLE TRADES /*
Here is a screenshot of some of the trades that are possible using these Low Timeframe POC's and some common sense.
s3.tradingview.com

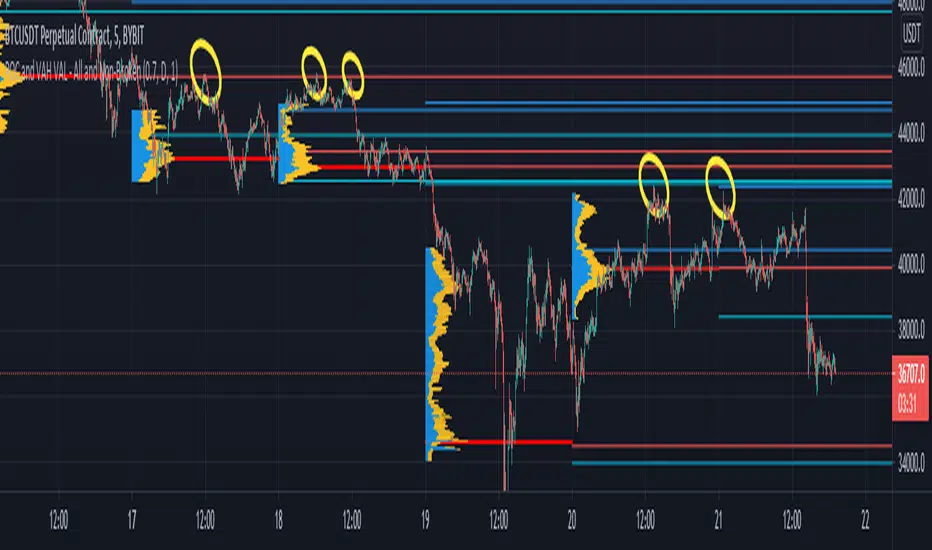
POCs and VAHs VALs - All and Non-BrokenThe "POC and VAH VAL - All and Non-Broken"
POC = Points of Control
VAH = Value Area High
VAL = Value Area Low
This indicator aims to show you on the 5 minute time frame all POCs and VAHs/VALs and Non-Broken POCs and VAHs/VALs.
(Non-Broken are POCS and VAHs/VALS where price action has not since crossed its path)
In the screen image above I have used VPVR to back test on BYBIT:BTCUSDT.
The POCs and VAHs/VALs for each day can be seen.
Also there is an option to see non-broken POCS and VAHs/VALs within the settings.
All display options are selectable within the settings.
The indicator is not as precise as using the VPVR but is a lot quicker and gives you a quick snapshot to assist with your technical analysis.
In the screen shot above are some examples highlighted with yellow circles (resistance at POC and VAHs/VALs).
Thanks goes to:
ahancock for use of his code.
Bjorn Mistiaen on StackOverFlow for his assistance.
Disclaimer:
Indicator has been coded to only show on 5 min time frame (after back testing seemed most accurate).
Only back tested on BYBIT:BTCUST.
There are some slight discrepancies.
Back tested against VPVR settings: Row Size 500, Value Area 70.
Maximum of 500 lines will only be shown.
SpaceTime Profiles Non Overlay SpacemanBTCSpaceTime Profiles Non Overlay is a tool used by many traders that aim to get more confluence with their trading style.
ALPHA V1.0.0
Typically, market profile can be used to help determine high value areas where a likely reaction is to occur when price reaches this level, this can provide market generated support and resistance . This indicator uses time price interaction to accurately create a market profile for TradingView, a feature that is useful for many traders who want to expand their knowledge.
User can choose to enable or disable lettering, and further features such as tick size and color are customizable.
Soon I will include additional features such as point of control extending the area of interest.
Currently works in non overlay mode, apply to existing panel to make it easier to chart lines.
Further more an overlay version is in the works
Looking forward to everyone trying this, you can appropriately message me for access.

Hancock - POC VAThis indicator shows POC (Point of Control) and VA (Value Area) High and Low as well as the developing ranges. This indicator makes use of the new arrays which means the resolution for calculating POC and VA is up to 100k bins at, in most cases, tick resolution and allows for custom time-frames.
Not much else needs to be said about this indicator.
Happy Trading
Hancock


VWAP Pack v1.00This script shows Volume Weighted Average Price (VWAP) from any TF in any TF chart. For example you can set 2 months VWAP in 30 minutes chart and see strong developing levels from higher TF. You can also switch on historical values. Together you can see 5 developing levels (POC, 2 first and 2 second standard deviation levels) and 5 historical levels from previous profile. Next levels you can use are Session open levels, which can be customized in any time you like (London open, NY open, ...) and you will see these periodicly on your chart. You can also fill the area between Point Of Control and Value Areas to see it more clearly. Last setting is High-Low of one session with changing Mean value in the middle.
send PM or visit website to get access

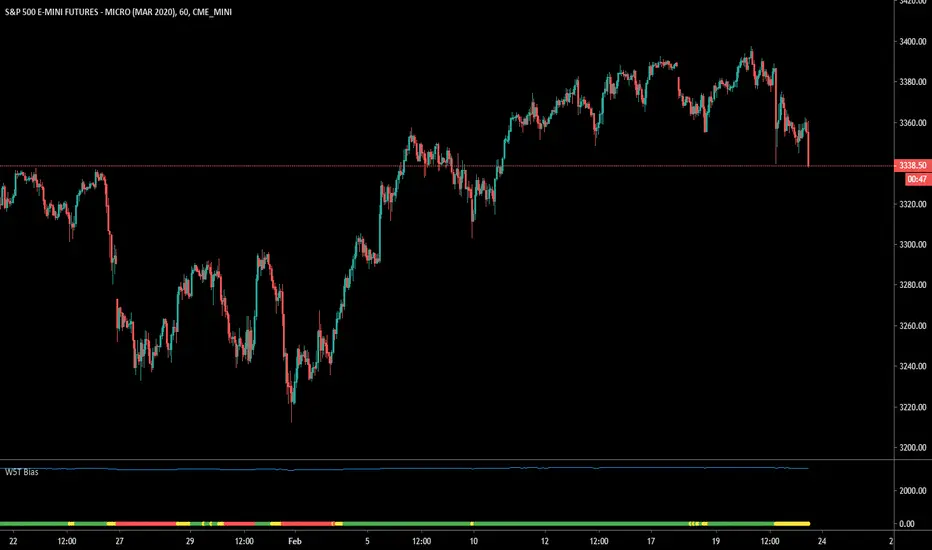
W5T Bias v2The Bias indicator is a sub-chart allowing the users of the main B.I.T.S (Breakout Intelligent Trading Signals Indicator) suite. This Bias indicator automatically looks at a higher time frame and indicates bullish , neutral and bearish Bias. This is respect to our 3 points of control EMA´s.
Check out our signature to learn more!
cPOC [Plot]This is a point of control script based between the length of two different conditions and the last time they were true (barssince() or whatever)
Been wanting to make this for a while simply because volume doesn't care about time, so why would a session based POC matter with that logic mind?
Will be improving on this more in time, just happy with the results of this prototype for now and figured it may be the first script I've ever made people will find useful so why not release it
This is the plots version (utilizing plot() instead of line.new) for longer lines and for the color change. Laggy if utilizing all the levels but my preferred version.
P.S. Thanks, Showerhead. You're finally cool

cPOC [Line]This is a point of control script based between the length of two different conditions and the last time they were true (barssince() or whatever)
Been wanting to make this for a while simply because volume doesn't care about time, so why would a session based POC matter with that logic mind?
Will be improving on this more in time, just happy with the results of this prototype for now and figured it may be the first script I've ever made people will find useful so why not release it
This is the lines version (utilizing line.new instead of plot()) for people who want a less laggy chart. Sacrifices the color flip for minimal lag and lines are much shorter.
P.S. Thanks, @paaax for the color switcher

Tradeer Price Action Pack v1.01This indicator is able to show many price action patterns that are not widely known to the public and many more. For example Point Of Control of every bar from used TF, Fibonachi retracement and extension based on weekly, monthly and yearly TF, it shows pivots in the right way on the chart. With this indicator trader can easily find strong support or resistence levels by using GAP (single) in price, it is not the overnight GAP many traders are using in stock market, but this one shows strong buying or selling pressure. There are many more options to display or set.

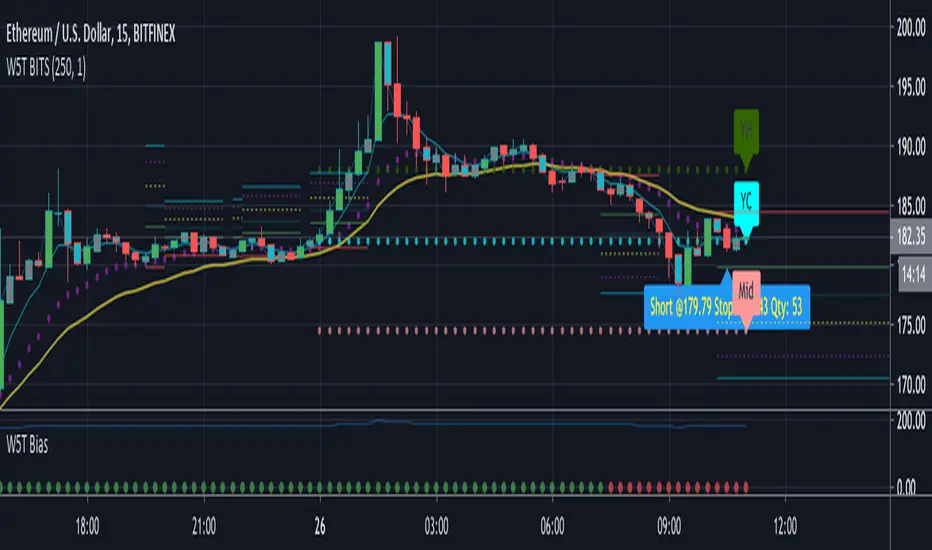
W5T Roller CoasterOur new Roller Coaster indicator is perfect for trading Stocks, Futures, Forex, Commodities, & Cryptocurrencies.
The Roller Coaster is a Stochastic/MACD Cross with Special EMA Points of Control for both Long and Short trades.
Our algorithm works everything out behind the scenes, keeping your chart clean.
With the purchase of our indicator, you will have access to:
Entry Price
Stop Loss Price
Trade Management
Trailing Stop Positions
Get in early on a Trend, or Trade Long & Short as an instrument moves with a range
Check out our signature to learn more!

W5T BiasThe Bias indicator is a sub-chart allowing the users of the main B.I.T.S (Breakout Intelligent Trading Signals Indicator) suite. This Bias indicator automatically looks at a higher timeframe and indicates bullish , neutral and bearish Bias. This is respect to our 3 points of control EMA´s.
Check out our signature to learn more!
RSI+A free addon for Profitable RSI . Equipped with RSI Values Distribution Profile, Point of Control, Value Area (customizable % based) and alert system.

Continuous Volume Profile v1.0This script is a continuous real time Volume Profile. Unlike the standard Volume Profile that focuses on fixed/visible range it will update and plot the following on every bar.
Point of Control (POC)
Value Area High (VAH)
Value Area Low (VAL)
You have the standard 3 parameters to configure:
Period Length
Number of Bins/Rows
Percent for Value Area
Please pm me if you would like to try the script.

⚛SHO - Simple Harmonic Oscillator by Cryptorhythms⚛SHO - Simple Harmonic Oscillator by Cryptorhythms
Intro
SHO – Simple Harmonic Oscillator - A Time Cycle Oscillator. Published in IFTA Journal 2018 by Akram El Sherbini.
Description
Bullish signals are generated when SHO crosses over 0
Bearish signals are generated when SHO crosses under 0
OverBought level is 40
OverSold level is -40
ExtremeOB level is 60
ExtremeOS level is -60
As with most oscillators, divergences can be taken advantage of.
Zero line represent the point of control between bears and bulls. A companion indicator to the Simple Harmonic Index ()
👍 Enjoying this indicator or find it useful? Please give me a like and follow! I post crypto analysis, price action strategies and free indicators regularly.
💬 Questions? Comments? Want to get access to an entire suite of proven trading indicators? Come visit us on telegram and chat, or just soak up some knowledge. We make timely posts about the market, news, and strategy everyday. Our community isn't open only to subscribers - everyone is welcome to join.
For Trialers & Chat: t.me
